
Case Study
Making Refrigeration Temperatures Visible Between Manual Checks
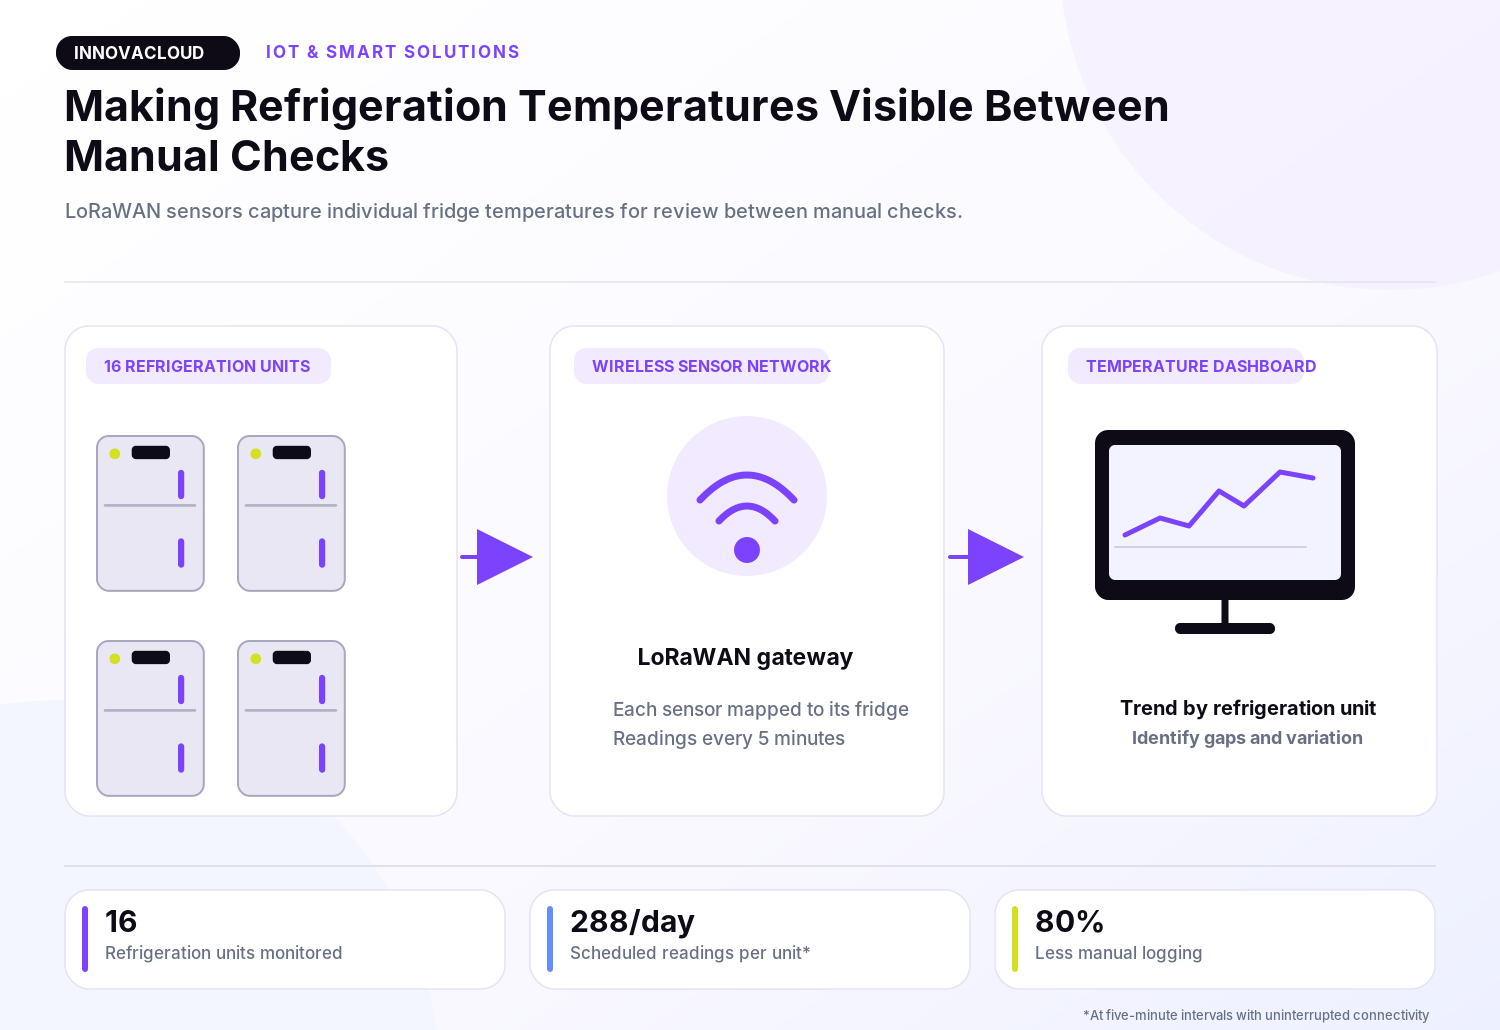
Innovacloud connected 16 refrigeration units through LoRaWAN temperature monitoring, capturing readings every five minutes and reducing manual logging time by 80%.
A hospitality business needed a clearer picture of refrigeration temperatures throughout the working day. Individual staff checks provided snapshots, leaving limited visibility into what happened between readings.
Innovacloud designed a connected monitoring approach that fitted the equipment in use and provided a consistent temperature history for each unit.
The system had to collect measurements from multiple refrigeration units and make those readings usable. Sensor placement, wireless communication and device identification all affected the quality of the resulting information.
The business needed to know which unit a reading belonged to and when it was recorded. A collection of disconnected measurements would not provide the operational view it required.
Innovacloud installed LoRaWAN temperature sensors and configured their connection through a gateway. Each sensor was mapped to its refrigeration unit, with readings collected at five-minute intervals.
We checked data delivery and organised the measurements by equipment, giving the business a consistent basis for reviewing temperature behaviour over time.
The LoRaWAN gateway passed sensor messages into ChirpStack, with MQTT used to forward the readings to Azure IoT Hub. A Grafana dashboard presented readings by refrigeration unit, making gaps and temperature trends easier to investigate. The configured five-minute interval allows up to 288 scheduled readings per unit per day when connectivity is uninterrupted.
The work joined the physical installation with the data collection process, creating a foundation that could also feed reporting software.
Sixteen refrigeration units were configured for readings every five minutes, equivalent to up to 288 scheduled measurements per unit each day. Manual logging time fell by 80% in this illustrative scenario.
Staff gained a more detailed temperature history to support operational checks while spending less time repeatedly recording measurements. The collected data also became available for downstream reporting and analysis.
16
Refrigeration units monitored
288/day
Scheduled readings per unit
80%
Reduction in manual logging time
Turn equipment readings into useful visibility
Talk to Innovacloud about sensors and connectivity that help your team understand conditions across your equipment.

Stay Ahead with Modern and Smart Tools
Use the right technology at the right time
Find out what modern tech can actually do for your business.
We help businesses work smarter, progress faster, and stay secure using the right technology at the right time.


